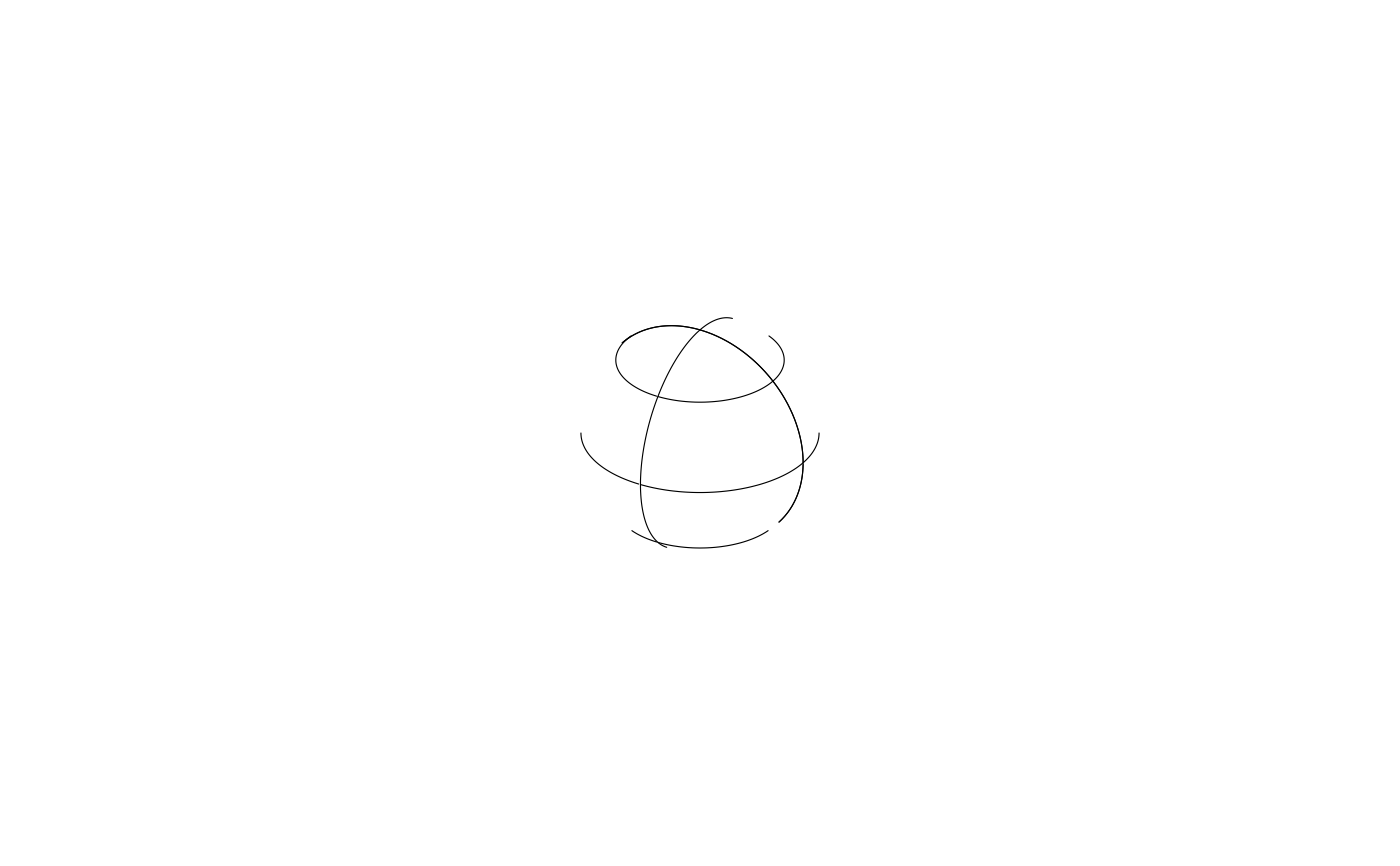
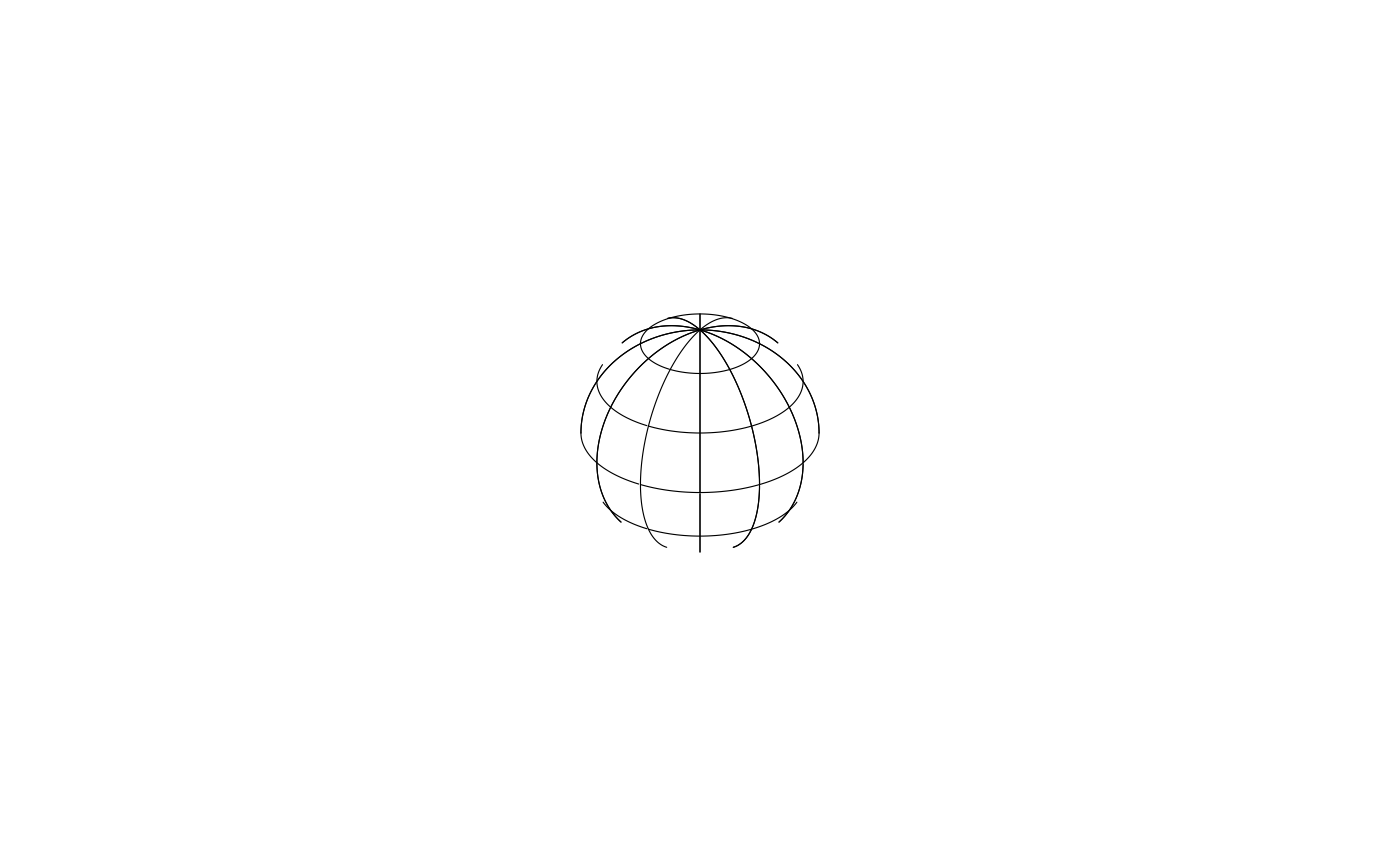
TDA's plglob3: longitude/latitude grid on a sphere.
Arguments
- radius
sphere radius.
- lon, lat
grid sequences (degrees).
- ...
passed to
tda_run.
Examples
# a globe with meridians every 30 degrees and parallels at -60..60
f <- tda_plglob3(1)
tda_plot_ps(tda_read_ps(f))
 # a coarser grid, as one command of a session
p <- tda_ps3(xlim = c(-2, 2), ylim = c(-2, 2), zlim = c(-2, 2))
p <- tda_pl(p, "plglob3", lon = "-90,0,90", lat = "-45,0,45", rhs = 1)
plot(p)
# a coarser grid, as one command of a session
p <- tda_ps3(xlim = c(-2, 2), ylim = c(-2, 2), zlim = c(-2, 2))
p <- tda_pl(p, "plglob3", lon = "-90,0,90", lat = "-45,0,45", rhs = 1)
plot(p)