Draws a Chart or ChartEx object on the current graphics device with
grid, approximating what a spreadsheet application shows for it.
Supported are bar/column (clustered, stacked, percent stacked, horizontal), line, area, scatter, bubble, pie, doughnut, pie of pie, bar of pie, radar and stock charts with titles, primary and secondary axes, gridlines, legend, markers, line styles, data labels, trendlines, error bars, high-low lines, drop lines and up-down bars; the 3D column, bar, line, area and pie types and surface charts (contour and 3D); and the extended types waterfall, box-and-whisker, histogram, Pareto, funnel, treemap and sunburst. Region maps are not drawn.
Arguments
- x
A
ChartorChartExobject.- wb
Optional
wbWorkbookthe series reference.- newpage
Call
grid::grid.newpage()first. DefaultTRUE.- ...
Ignored.
Details
The values come from the series caches (present when a series was added
from wb_data()) or are read from wb. Series added with plain range
strings and all ChartEx objects need wb.
Axis scaling follows the rules for automatic axes; fonts, spacing and
the exact placement of labels differ from the original. Number formats are
approximated for common codes (0, 0.00, #,##0, 0%, date formats).
Examples
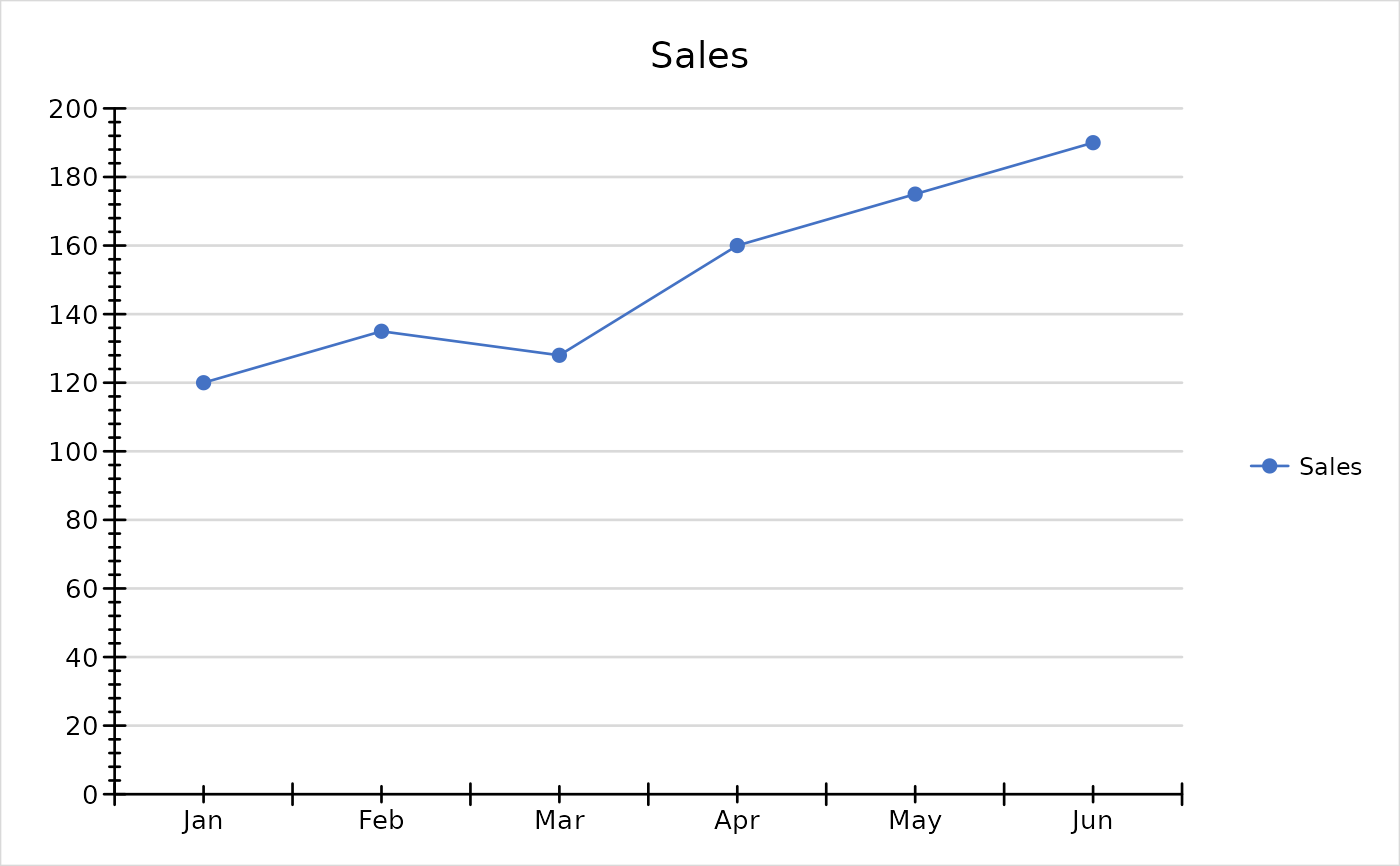
wb <- openxlsx2::wb_workbook()$add_worksheet("Data")$add_data(x = data.frame(
  Month = month.abb[1:6], Sales = c(120, 135, 128, 160, 175, 190)
))
chart <- ec("line")$set_chart_title("Sales")$
  add_series(name = Sales, data = openxlsx2::wb_data(wb), label = Month, marker = "circle")
plot(chart)