library(openxlsx2)

## create a workbook
wb <- wb_workbook()7 Charts
The following manual will present various ways to add plots and charts to openxlsx2 worksheets and even chartsheets. This assumes that you have basic knowledge how to handle openxlsx2 and are familiar with either the default R graphics functions like plot() or barplot() and grDevices, or with the packages {ggplot2}, {rvg}, or {encharter} and {mschart}. There are plenty of other manuals that cover using these packages better than we could ever tell you to.
7.1 Adding a chart as an image to a workbook
You can include any image in PNG or JPEG format. Simply open a device and save the output and pass it to the worksheet with wb_add_image().
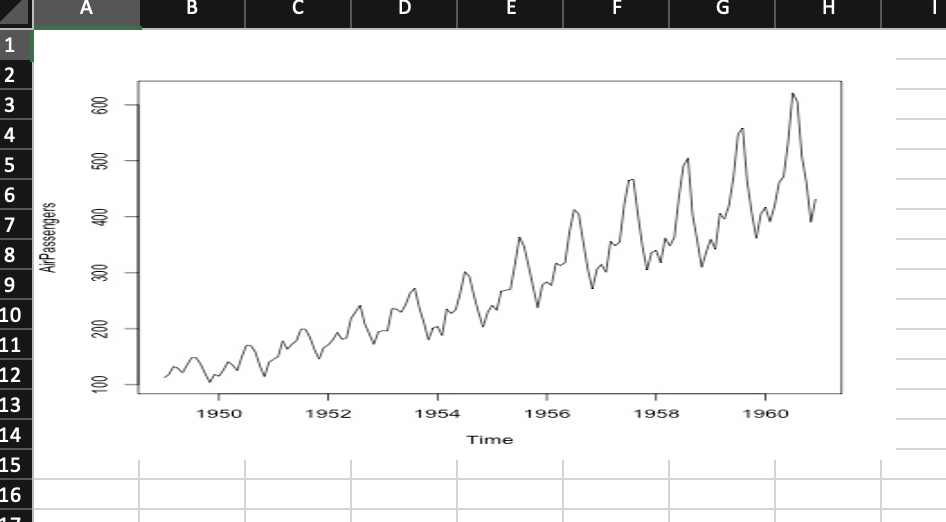
It is possible to use {ragg} to create the png files to add to the worksheet:
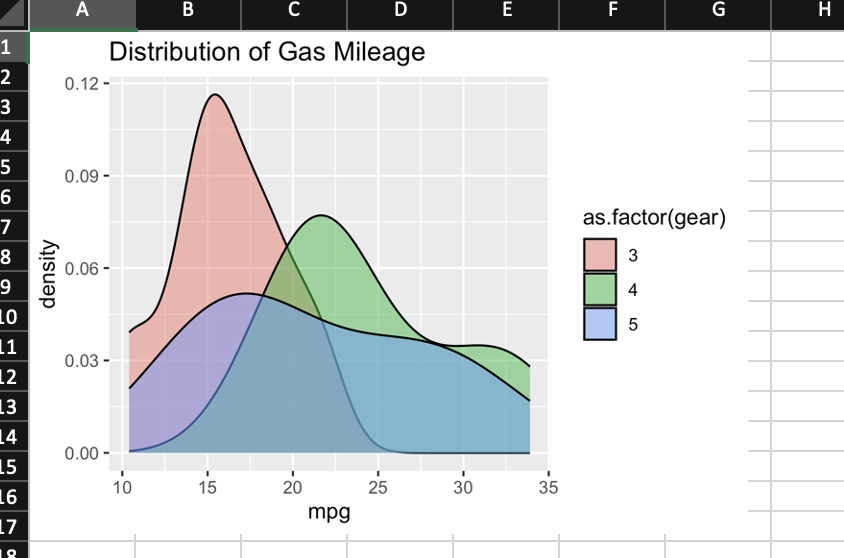
7.2 Adding {ggplot2} plots to a workbook
You can include ggplot2 plots similar to how you would include them with openxlsx. Call the plot first and afterwards use wb_add_plot().
7.3 Adding plots via {rvg} or {devEMF}
If you want vector graphics that can be modified in spreadsheet software the dml_xlsx() device comes in handy. You can pass the output via wb_add_drawing().
library(rvg)

## create rvg example
tmp <- tempfile(fileext = ".xml")
dml_xlsx(file =  tmp, fonts = list(sans = "Bradley Hand"))
#> Warning: Font families not found on this system and replaced by defaults:
#> "sans". Use gdtools::font_family_exists() to check availability.
ggplot(data = iris,
       mapping = aes(x = Sepal.Length, y = Petal.Width)) +
  geom_point() + labs(title = "With font Bradley Hand") +
  theme_minimal(base_family = "sans", base_size = 18)
invisible(dev.off())

# Add rvg to the workbook
wb$add_worksheet("add_drawing")$
  add_drawing(xml = tmp)$
  add_drawing(xml = tmp, dims = NULL)
library(devEMF)

tmp_emf <- tempfile(fileext = ".emf")
devEMF::emf(file = tmp_emf)
ggplot(data = iris,
       mapping = aes(x = Sepal.Length, y = Petal.Width)) +
  geom_point()
dev.off()
#> png
#>   2

# Add rvg to the workbook
wb$add_worksheet("add_emf")$
  add_drawing(dims = "A1:D4", xml = tmp)$
  add_image(dims = "E1:H4", file = tmp_emf)
7.4 Adding {encharter} plots
library(encharter)

df_bar <- data.frame(
  Product = c("Software", "Services", "Hardware", "Support"),
  Q1      = c(310, 195, 140, 85),
  Q2      = c(340, 210, 130, 90),
  Q3      = c(375, 225, 125, 95),
  Q4      = c(420, 250, 120, 105)
)

wb <- wb_add_worksheet(wb, "add_encharter", grid_lines = FALSE)
wb <- wb_add_data_table(
  wb, sheet = "add_encharter", x = df_bar,
  dims = "A1", table_style = "TableStyleMedium2"
)
wb <- wb_set_col_widths(wb, sheet = "add_encharter", cols = 1:5, widths = c(12, 8, 8, 8, 8))
wb_df <- wb_data(wb)

chart <- ec("barChart")
chart$set_chart_title("Quarterly Revenue by Product (EUR k)", bold = TRUE)
chart$set_y_axis(min = 0, format = "#,##0", grid_lines = TRUE, grid_color = "EEEEEE")

colors    <- c("2E4057", "048A81", "E84855", "F4A261")
quarters  <- c("Q1", "Q2", "Q3", "Q4")
cols      <- c("B",  "C",  "D",  "E")
variables <- names(wb_df)
for (i in seq_along(quarters)) {
  chart$add_series(
    name   = variables[i + 1L],
    label  = variables[1L],
    data   = wb_df,
    color  = colors[i]
  )
}

chart$set_legend_style(pos = "bottom")

wb <- wb_add_encharter(wb, sheet = "add_encharter", graph = chart, dims = "G1:P18")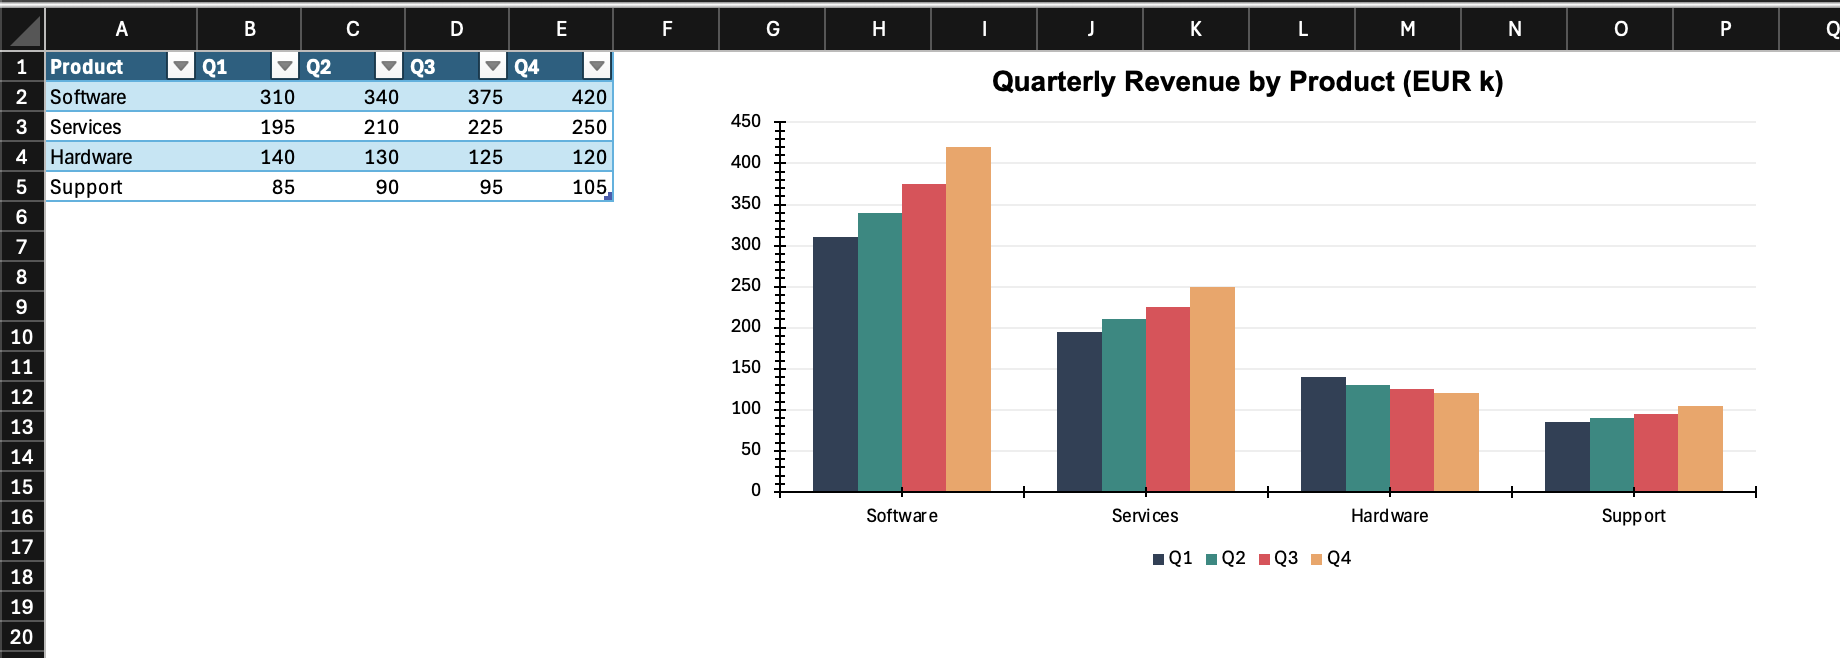
A broad selection of potential chart types available to encharter (Garbuszus 2026) can be found in the project homepage: “https://github.com/JanMarvin/encharter” and in its examples folder. The package was created specifically to support various chart types in openxlsx2. This includes combo charts, as well as several chart features such as trend lines, secondary axis and modern spreadsheet charts such as Box and Whisker charts. The package supports the openxlsx2 functions wb_color() and fmt_txt() to tweak colors and text.
7.4.1 Add and fill a chartsheet
Finally it is possible to add encharter objects into chartsheets. These are special sheets that contain only a chart object, referencing data from another sheet.
# add chartsheet
wb <- wb |>
  wb_add_chartsheet() |>
  wb_add_encharter(graph = chart)
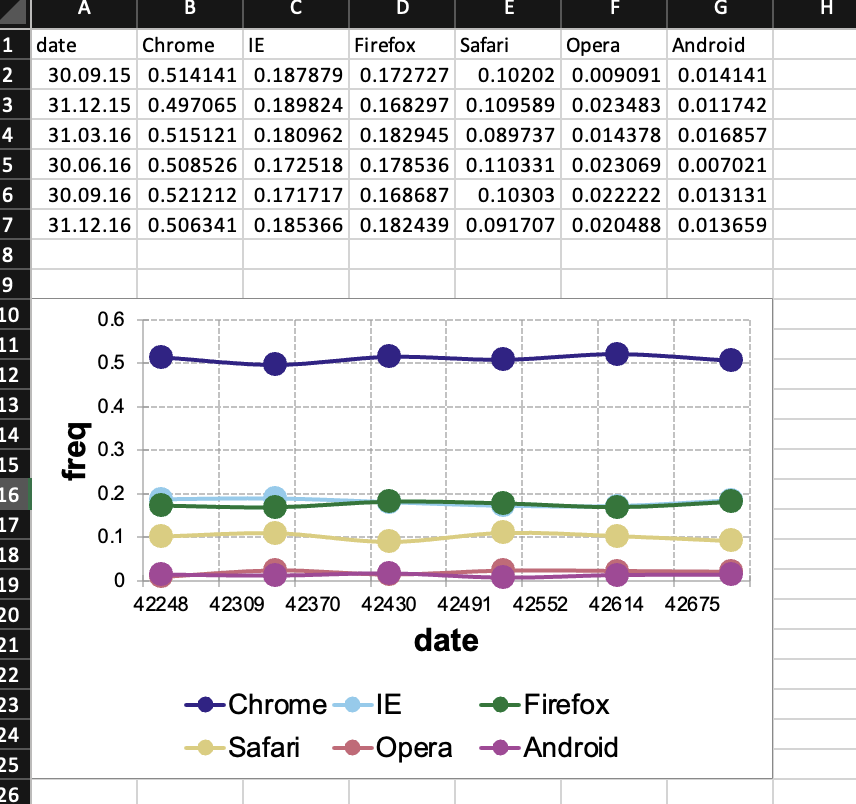
7.5 Adding {mschart} plots
Support for the mschart (Gohel 2026) package provides functionality to add charts that can be used with spreadsheets. This might be useful for users of the officer package (Gohel et al. 2026).
library(mschart)
#>
#> Attaching package: 'mschart'
#> The following object is masked from 'package:ggplot2':
#>
#>     set_theme

## create chart from mschart object (this creates new input data)
mylc <- ms_linechart(
  data = browser_ts,
  x = "date",
  y = "freq",
  group = "browser"
)

wb$add_worksheet("add_mschart")$add_mschart(dims = "A10:G25", graph = mylc)